Why Data Alone Is Useless: How to Create Insights Instead of Trash
Learn why raw data needs context to become actionable insights and how the DIKW model enables smarter, real-world applications
“It’s currently 29” the screen’s red lights show
Clumps of dead pixels across the text looks like a mud splatter of darkness over the sentence. Snow softly falls across the lifeless parking lot below the billboard.
Nothing stirs
“It’s currently 29” a pleasant computer voice chimes
“and the forecast today has full sun throughout the afternoon” she continues.
The back of the car is a tightly-packed mosaic of coolers, cooking supplies, and sunglass-wearing college students.
“Thanks Siri! Dude, today is like the perfect day to get outside. I’m glad you planned this trip
You’re always collecting data.
Even if you don’t mean to, your brain is always on the lookout for things to notice.
But the process of turning ‘things you notice’ into ‘insights’ in daily life is so intuitive that we don’t generally consider how complex it is.
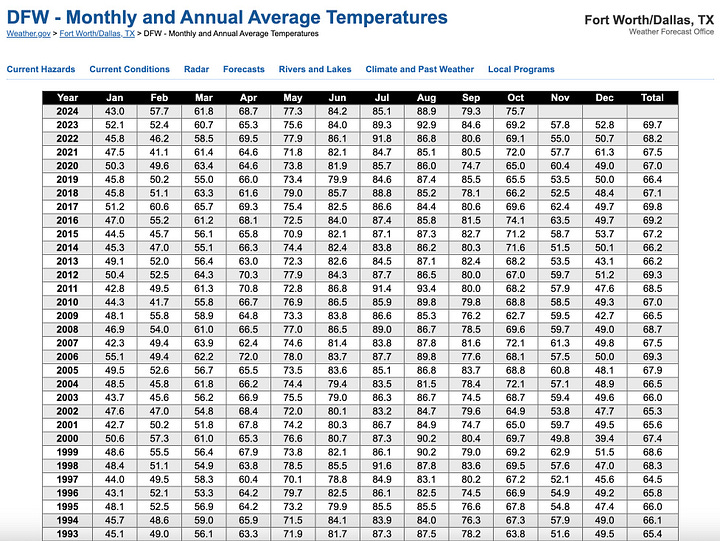
Think about the two opening scenes above. They both have the same data, but the insights from that aren’t the same at all.
But the ‘data’ given in the story above—a measurement of 29—was useless without the context that it was a temperature.
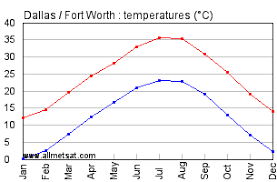
With that context, it still wasn’t useful until you knew one was in Fahrenheit and the other in Celsius.
And unless you’ve lived somewhere that has weather in that range, you might not instinctively realize you need to wear a jacket in one vs a swimsuit in the other
This seems like an obvious example1 but none of the separate data pieces would be useful to you if you’d grown up in a lab.
Businesses similarly gather data too
And just like how we turn a measurement into an insight for wardrobe reasons, we should do the same for businesses.
What drives decisions2 is how data is refined and interpreted. It’s distilled through stages of understanding to become actionable and valuable.
Related Posts
For a more in-depth discussion of how data is gathered by a computer, check out the articles in this series:
This discussion about data-to-action can feel awfully abstract—luckily the military has developed a framework to manage the act of creating these insights.3
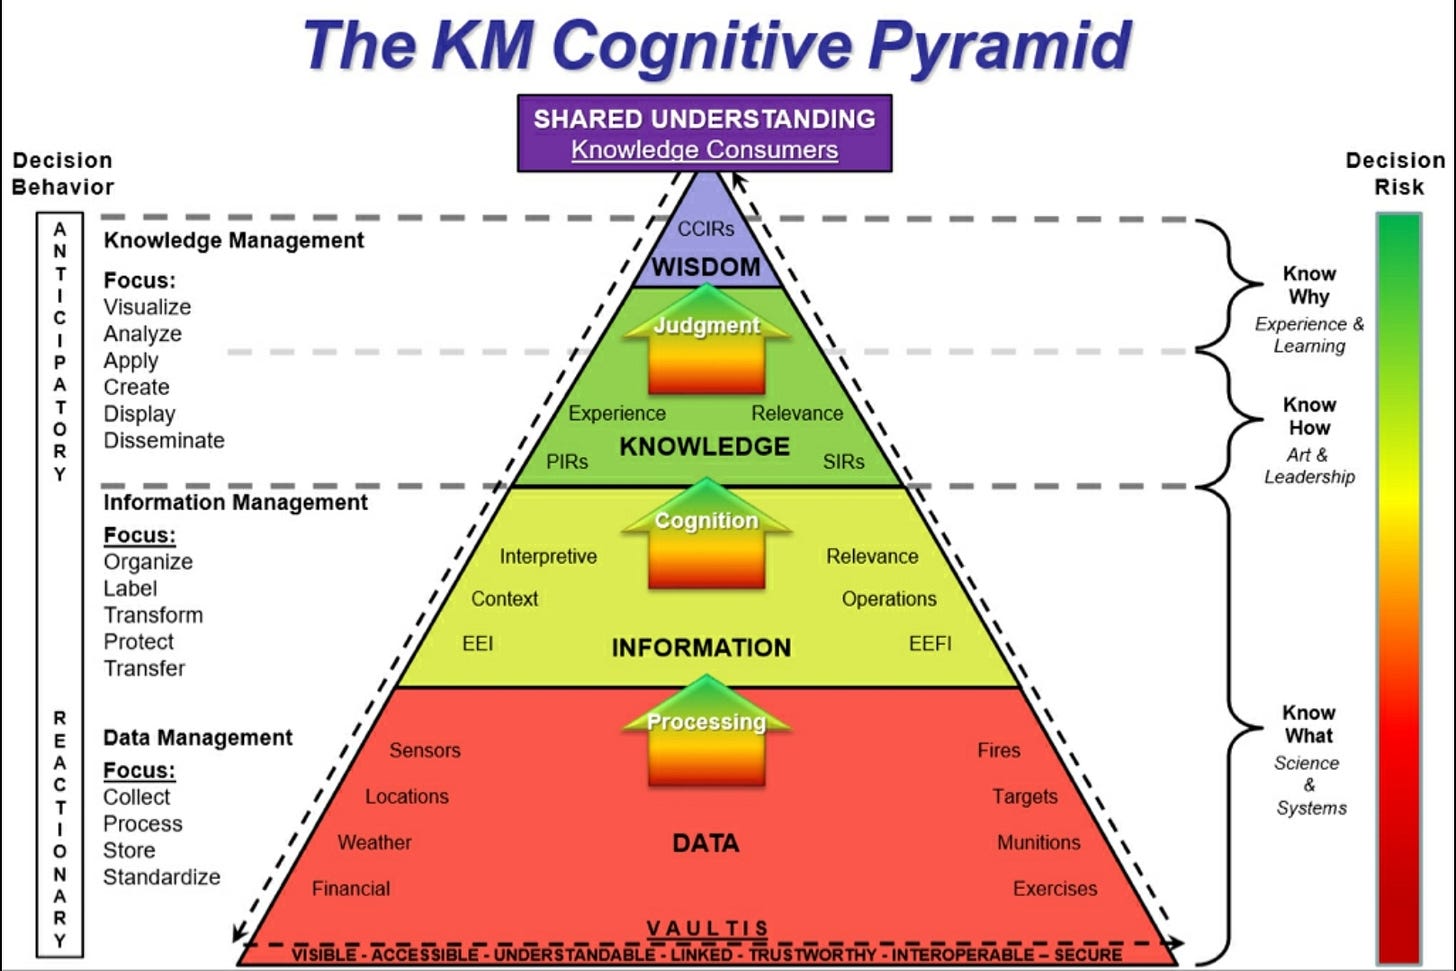
The DIKW (Data-Information-Knowledge-Wisdom) hierarchy is a framework that transforms raw data into useful ‘wisdom’—meaningful, time-bound insights that should guide decisions.4
This approach provides a formalized set of steps for businesses to process numbers into strategies5.
In this post we’ll cover each stage to understand how data becomes business intelligence.
1. Data: The Raw Material
Definition and Characteristics
Data is unfiltered, unprocessed input. ‘42’ is data. ‘5.0’ is data. ‘True’ is data.
In marketing, data could be the number of clicks on an ad (42), the highest converting version of an ad (5.0), or an email newsletter opt-in decision (True).
These measurements—in isolation—are just values. They don’t yet tell us anything meaningful about trends or what customers want.
Processes to Manage Data
Collection and Cleansing: The first step is to ensure data quality. Data integrity is essential, as unreliable data leads to flawed conclusions—worse than nothing.
Check that data is accurate and consistent before processing it6. A single rotten piece of meat ruins a whole batch of sausage.
Storage and Accessibility: Data should be stored in a way that’s accessible for analysis. Organized storage systems, such as databases or customer data platforms (CDPs), keep data ready for transformation and are easy to audit and share across departments.
Data is foundational but has limited use on its own. It’s like eggs and flours in a cake recipe—they’re required, but not sufficient in their raw state🥚.
2. Information: Data with Context
Definition and Characteristics
Information arises when data is organized, contextualized, and summarized.


If we look at a month’s worth of daily clicks on a marketing campaign and aggregate it, we start to see patterns. Maybe some days perform better than others, or there’s a weekly peak.
Is there a seasonal effect? Was your ad campaign actually effective or was it just before a holiday anyway?
This information is far more insightful than raw click counts because it starts to tell a story.
Processes for Turning Data into Information
Aggregation and Organization: Information is created when data is grouped to reveal patterns, like a weekly report on ad clicks or a chart showing trends over time. Organizing data this way makes it easier to spot patterns, like increased engagement on certain days.
Visualization: Data visualizations, such as graphs or heat maps (please no pie charts!), make information clearer and more understandable. For example, a heat map of website clicks (see below) can show marketers which parts of a landing page get the most attention whereas a data table of this would be impossible to parse.
How Web Search Behavior Is Changing In 2024
·Last week’s post was a primer on Search Engine Optimization (SEO).
Why Information Isn’t Enough
Information helps identify patterns, but it still doesn’t explain “why” those patterns exist.
Information alone doesn’t provide the insights businesses need for decision-making.
Understanding “why” requires a deeper look—this is where the next level ‘knowledge’ comes into play.
3. Knowledge: Insights and Understanding
Definition and Characteristics
Knowledge is generated when information is interpreted.
This is usually a natural continuation of generating ‘information’ in areas you have domain knowledge.
In our marketing example, knowledge could reveal why certain days perform better: maybe engagement spikes on payday, or perhaps specific times align with customers’ browsing habits.
You might find yourself automatically interpreting organized data when creating it, but it’s a distinct step in the hierarchy.
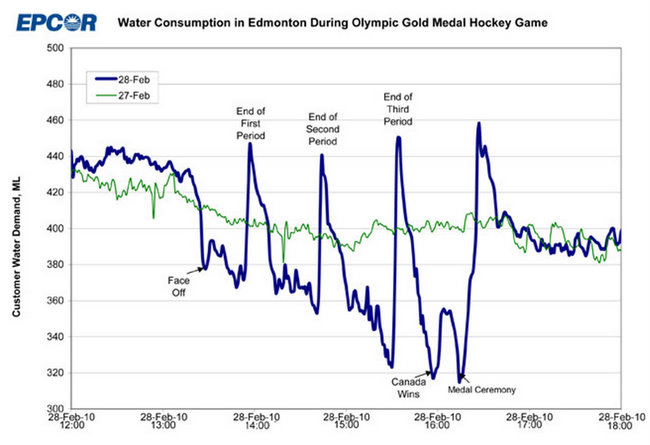
For example, the graph below might make you think the water infrastructure in Edmonton was on the verge of failure if you analyzed it from afar. But if you’re a hockey fan and live there, then you’d naturally understand what was going on when you generated the visualization.
This step requires domain knowledge in the field to move from information to ‘knowledge'.
Processes for Transforming Information into Knowledge
Analysis and Interpretation: This is the stage where you find the “why” behind the patterns in your information. By analyzing trends and comparing them to known variables (like customer demographics or seasonality), businesses develop an understanding of what drives those trends. Using customer interviews after generating ‘information’ can help you understand the underlying factors that contribute to ‘knowledge’
Applying Context: Context from past experience or market conditions adds depth to understanding7. For example, seeing a surge in winter sales of outdoor gear is informative, but adding context—such as an unusually snowy winter—turns this into knowledge about seasonal demand.
Answering the “So What”
Knowledge addresses the “so what” of patterns, helping businesses understand why trends occur. But even knowledge isn’t always enough for direct decision-making. Turning it into wisdom requires looking ahead, using these insights to forecast and strategize.
4. Wisdom: Actionable, Strategic Intelligence
Definition and Characteristics
Wisdom is the final (frankly optional) stage: it’s actionable, contextually relevant, and strategic.
Wisdom tells businesses how to act based on knowledge. For a marketer, wisdom might mean adjusting context messages to increase conversion on confusing forms or tailoring messaging around a weekly payday for trade workers and bi-weekly for salaried employees.8
This is the level where data-driven analysis alone is not sufficient. You need to use your human intelligence and model of the world to overlay onto your measured information.
Wisdom is intelligence in action, helping businesses make decisions that drive outcomes.
Processes for Generating Wisdom
Forecasting and Predictive Analysis: Wisdom often involves predicting likely outcomes. Predictive analytics tools can model customer behavior based on past trends. For example, if knowledge shows that sales spike on payday, wisdom might mean planning campaigns to run just before payday each month—but also weighing the costs of the ads to see if that insight is worth acting on at all.
Risk Assessment and Adaptation: Wisdom is not infallible—it works within probable outcomes rather than certainties. But you can pre-plan your actions so that you learn something either way an outcome goes.
Intelligence frameworks, especially in military contexts, emphasize a feedback loop. In this case, businesses should regularly revisit strategies, refining them as new data or outcomes emerge.
⚠️ Note: Insights Have a Shelf Life! ⚠️
One crucial aspect of wisdom is that it has a “shelf life.” Market conditions, customer preferences, and other factors change constantly.It doesn’t matter if you have 99% certainty on a football play your opponent will run if the play ended 3 hours ago. A 20% certainty before the play is run is much more valuable
To maintain relevance, businesses must revisit their intelligence regularly. Even if the outcome / insight doesn’t change, it’s important to make sure the underlying assumptions are still accurate
Conclusion
Intelligence is powerful, but it’s not a crystal ball.
While intelligence reduces uncertainty, it does not eliminate it. Over-reliance on predictions can lead to overconfidence, making it important for you to weigh decisions carefully.
Information is powerful, but it is nothing without context.
While information can reduce uncertainty, it doesn’t eliminate it. Over reliance on predictions and statistics without context ca lead to overconfidence, making it important for you to weigh decisions carefully.
Intelligence operates within probabilities, and realistic expectations help businesses use it effectively.
The DIKW model offers a clear path from raw data to usable intelligence .
However, this process requires more than collecting more raw data; it involves refining, interpreting, and continuously adjusting.
By formally considering what the stages of intelligence in your business means, you can use gather and manage intelligence as a powerful tool to make good decisions.
and it is!
and actions
In a fascinating way that media drives common thought, the origin of this model may be from poetry.
Some authors think that the idea of the DIKW relationship originated from part of the T. S. Eliot poem "Choruses":
Where is the wisdom we have lost in knowledge?
Where is the knowledge we have lost in information?
Example: Applying DIKW to Marketing Strategy
Using the DIKW model in marketing can turn raw engagement metrics into refined strategies:
Data: Collect raw metrics, like website clicks, ad impressions, and daily email open rates.
Information: Aggregate data into weekly performance summaries, highlighting patterns like peak engagement days.
Knowledge: Analyze patterns to understand customer behaviors, such as identifying that engagement rises around specific times or paydays.
Wisdom: Adjust strategies based on insights, such as increasing ad spend on peak days or creating campaigns that resonate with payday audiences.
And also that everyone uses the same terminology / fields for the same thing. Don’t have bad cross-pollination
Yeah, turns out experience is actually worth a lot. Fortunately/unfortunately, the tech-driven belief that raw intelligence can overcome all runs against some serious roadblocks at this phase of interpretation.
And you also need to use your understanding of relevant laws, competitive field, costs of different ad channels, workload on your employees, etc to make good business decisions at this stage.


