
How to Fix Your Marketing's Data Foundation
Ward's Marketing Data Hierarchy for How to Structure Your MarTech Solutions

In marketing data, more isn’t always better.
In fact, more USUALLY isn’t better. Facebook, Google, and the like are exceptions to the rule.
Unless you’re able to get the right answer from the right data at the right time, you aren’t using data correctly.
That may sound like an abstract problem—but MOST marketer’s today still aren’t able to accurately do core kinds of analysis.
Glenn Vanderlinden—at Human 37—pointed out how ridiculous the state of marketing technology is. His findings are from the most recent Salesforce State of Marketing

Instead of trying to build AI tooling on top of a shifting pile of sand—metaphorically1—start from the bottom and build up confidently.

Like Maslow’s Hierarchy of Needs, we’ll build up to a final Ward’s Marketing Data Hierarchy™️2.

By the end of this post, you’ll have a good understanding of where different KPIs come into play, key activities, and where you should focus your attention.
We’ll break down marketing data into three tiers:
Descriptive Statistics
Group Statistics
Predictions
By the end, you’ll have a clear understanding of how to build a robust MarTech stack that can help you drive better decision-making and customer engagement.
Tier 1: Descriptive Statistics
Why This Tier is Important:
Garbage In, Garbage Out (GIGO): If your foundational data is inaccurate any advanced analysis built on this data will be wrong.
Clear Data Definitions: Establishing clear definitions for your data makes sure your company-wide data has good integrity.

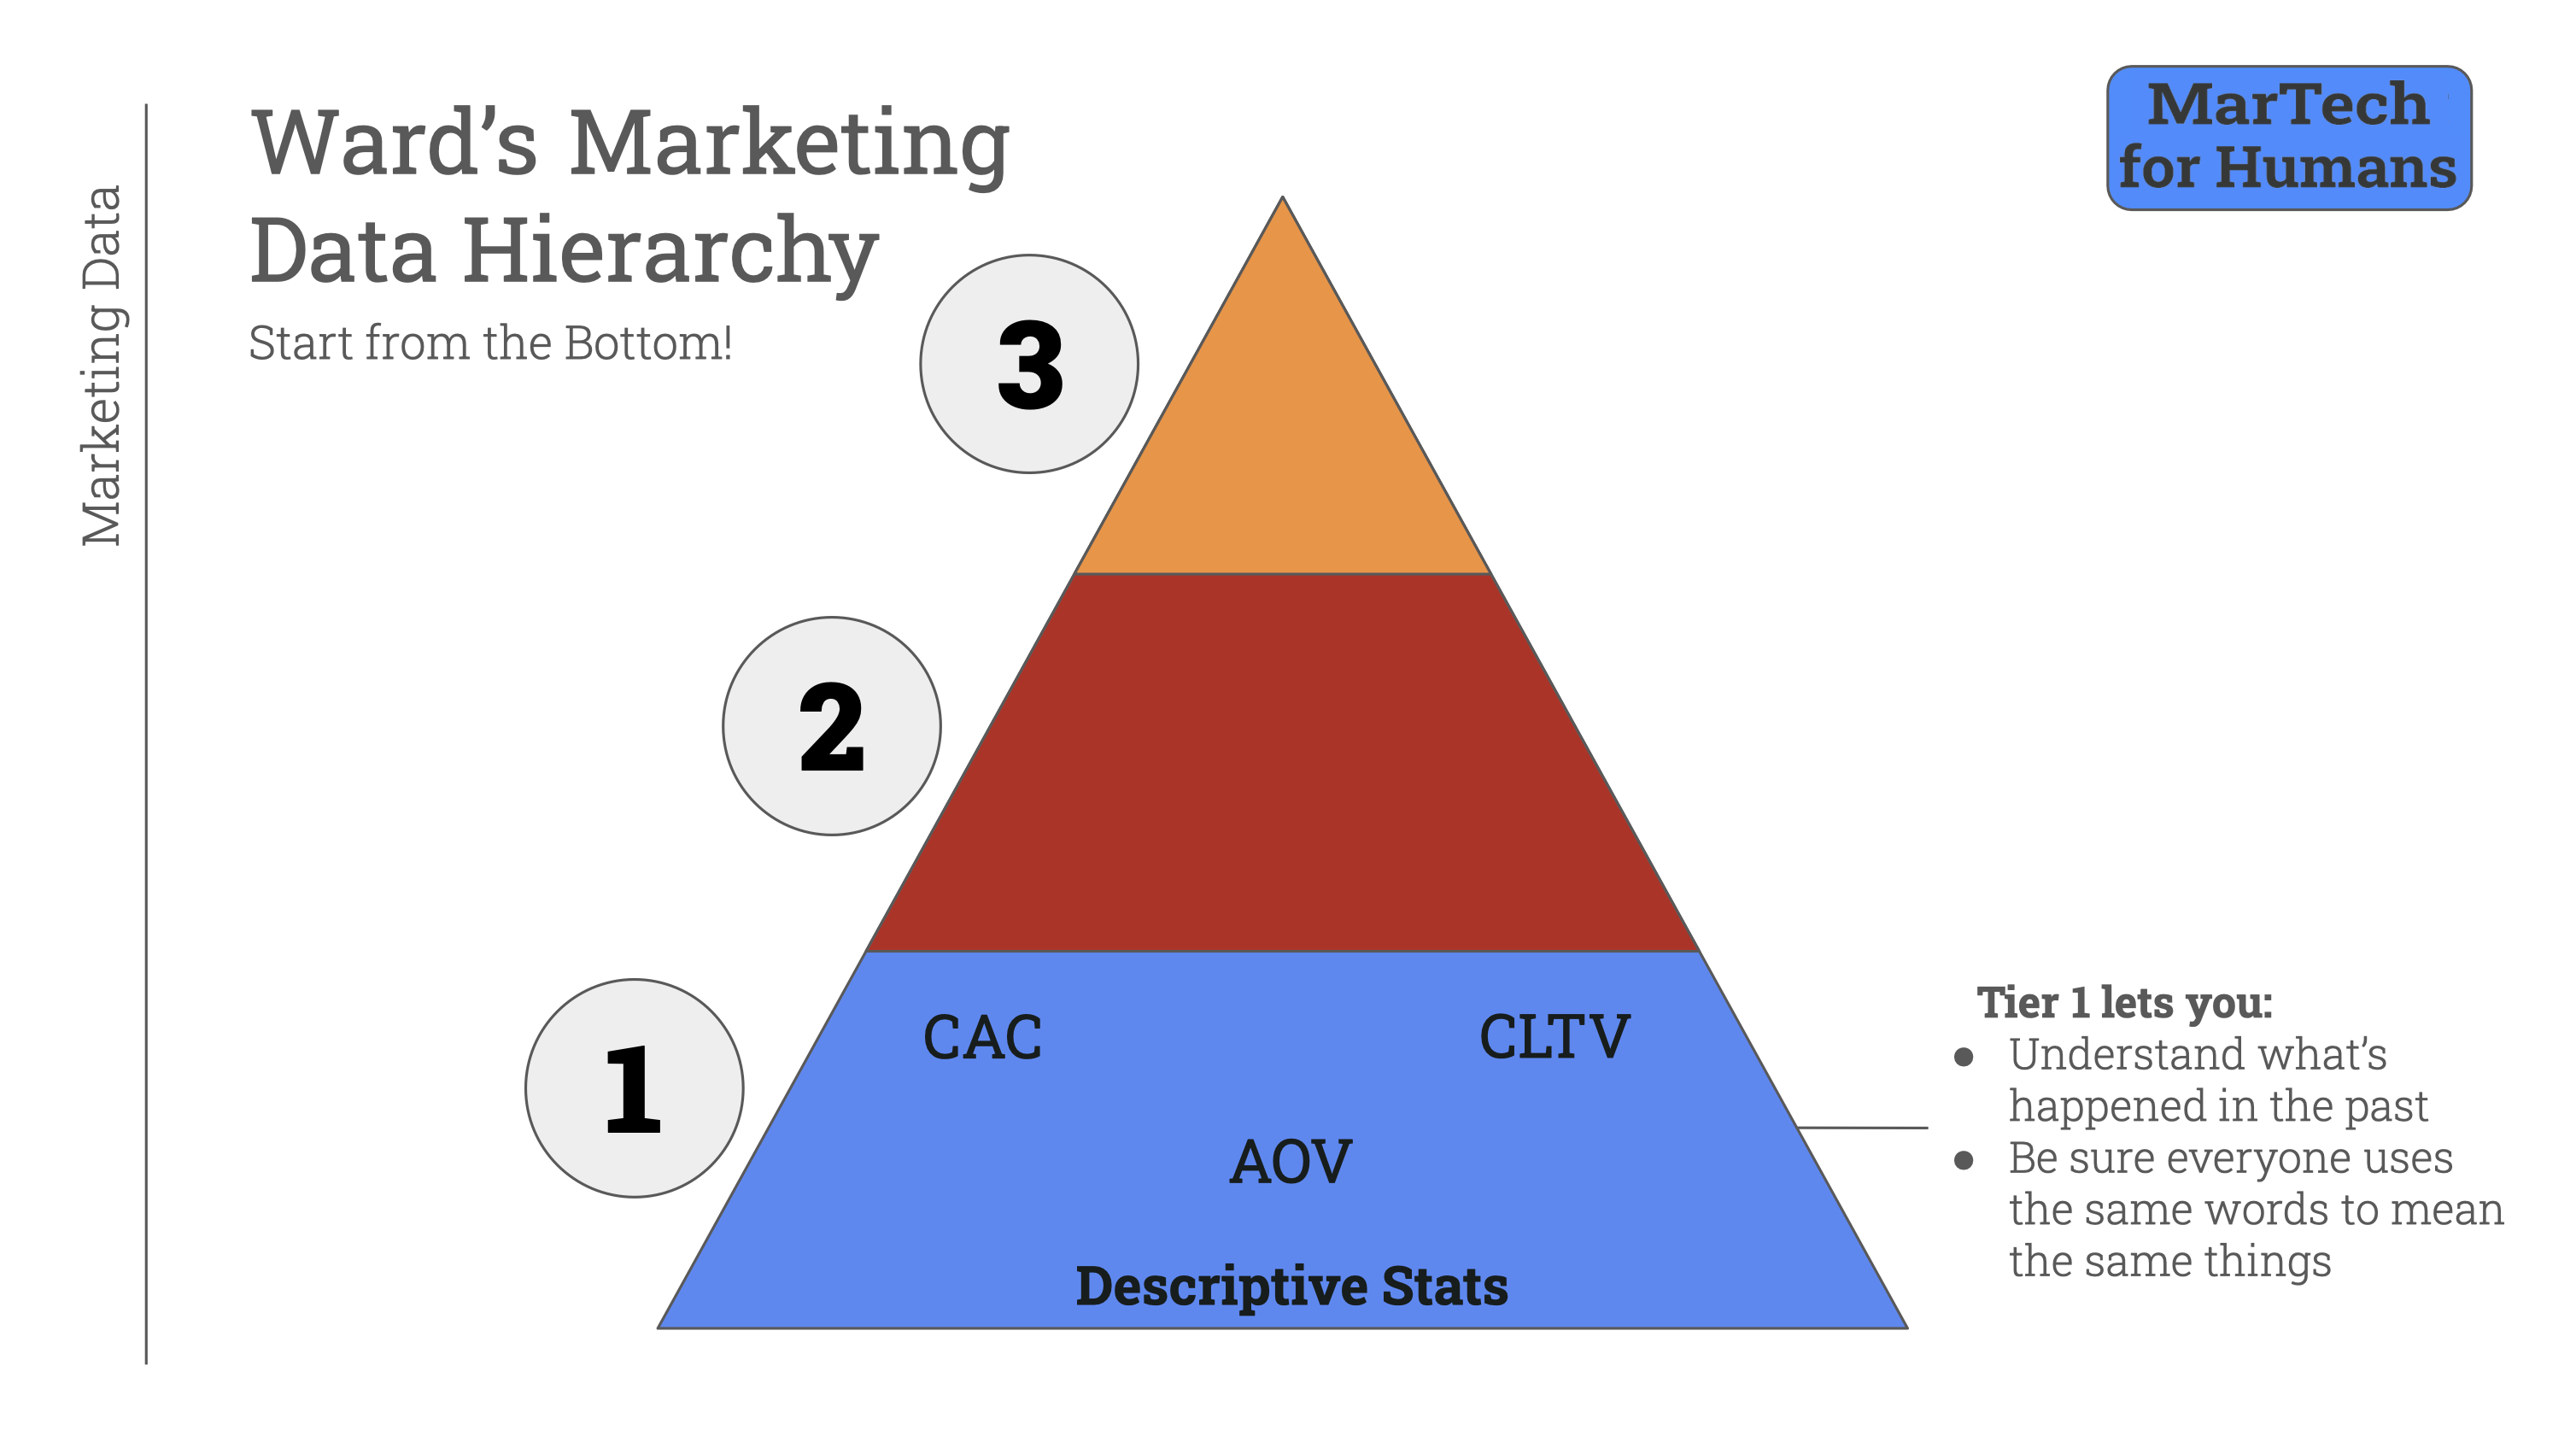
The foundation of your marketing data should start with descriptive statistics.

In this tier, you should understand what has already happened with your customers and be sure everyone at your company uses the same data language.
Why Start Here?
Imagine someone asked:
“What’s your friend Steve like?”
It wouldn’t be helpful to say something like:
“He’s very creative. He’s likely to buy luxury appliances in the next few years. He’s 57% likely to respond to our emails.”
Instead, you’d start with:
“He’s a young, tall man who loves wearing striped sweaters and hanging out with dogs.”
Obviously, I’m referring to Steve from Blues Clues

Descriptions are the best way to understand your customers.
Creating this tier of data is the most important—but least sexy—part of MarTech.
This level includes basic metrics that provide insights into specific customer behaviors.
Key Activities in This Tier:
Define a Common Data Language
Beyond just tracking the right KPIs, you need to make sure everyone understands what each term means. For example, when marketing has a table of “customers”, does that mean the same thing as accounting’s list?
Understand How to Manage Buy-In
You’ll likely discover some areas where your data infrastructure is lacking. Make sure you know how to manage buy-in across departments to get a project started.
Common KPIs at this stage:
Cumulative Lifetime Value (CLTV): What is the total revenue a customer has generated3 during their relationship with your business?
Customer Acquisition Cost (CAC): How much does it cost to acquire a new customer4?
Average Order Value (AOV): How much does the average customer spend on each order?
These stats show what has already occurred. Use these to make sure your business decisions are reasonable.
Start by laying a solid foundation with accurate and well-defined statistics.
You’ll set yourself up for success in the more advanced tiers of data analysis.
Tier 2: Group Statistics
Why This Tier is Important:
Enhanced Group Insights: If you look at data across different segments, you can identify trends that aren’t apparent at the individual level.
Effective Campaign and Channel Analysis: You can give a good, data-driven answer when your boss asks about the effectiveness of your marketing campaigns and why you chose each channel.


Once you have a solid foundation of individual statistics, the next step is to analyze group behaviors.
This tier involves segmenting your audience and analyzing data across different customer groups.
Key Activities in This Tier:
Customer Segmentation: Divide your audience into segments and find patterns that aren’t apparent in aggregate.
Channel Analysis: Evaluate the performance of different marketing channels to determine which are best suited for your purpose.
Campaign Performance: Analyze the results of your campaigns to see what worked (and what didn’t).
Understanding Data Limitations: Recognizing the limitations of your data will reduce the chance you make a bad data decision. For example, knowing that your data might be biased towards more recent customers—because you just implemented better tracking—helps make more accurate interpretations.
Common KPIs at this stage:
Customer Segmentation Metrics: What is the performance of different customer segments? Metrics might include segment-specific CLTV, AOV, or churn rates.
Channel Performance Metrics: Evaluate channel metrics like Cost Per Acquisition (CPA), Return on Ad Spend (ROAS), and click-through rates (CTR).
Engagement Rates: How do different customer groups interact with your content? Common metrics are email open rates, social media engagement, and website conversions.
Tier 3: Predictions
Why This Tier is Important:
Strategic Decision-Making: Predictive analytics provides insights that can guide high-level strategic planning.
Behavioral Insights: Understanding what drives customer behavior enables you to tailor your marketing efforts more effectively.
Sensitivity Analysis: You have a good understanding of the levers of marketing influence you wield. Maximize your effort:reward ratio using this information.
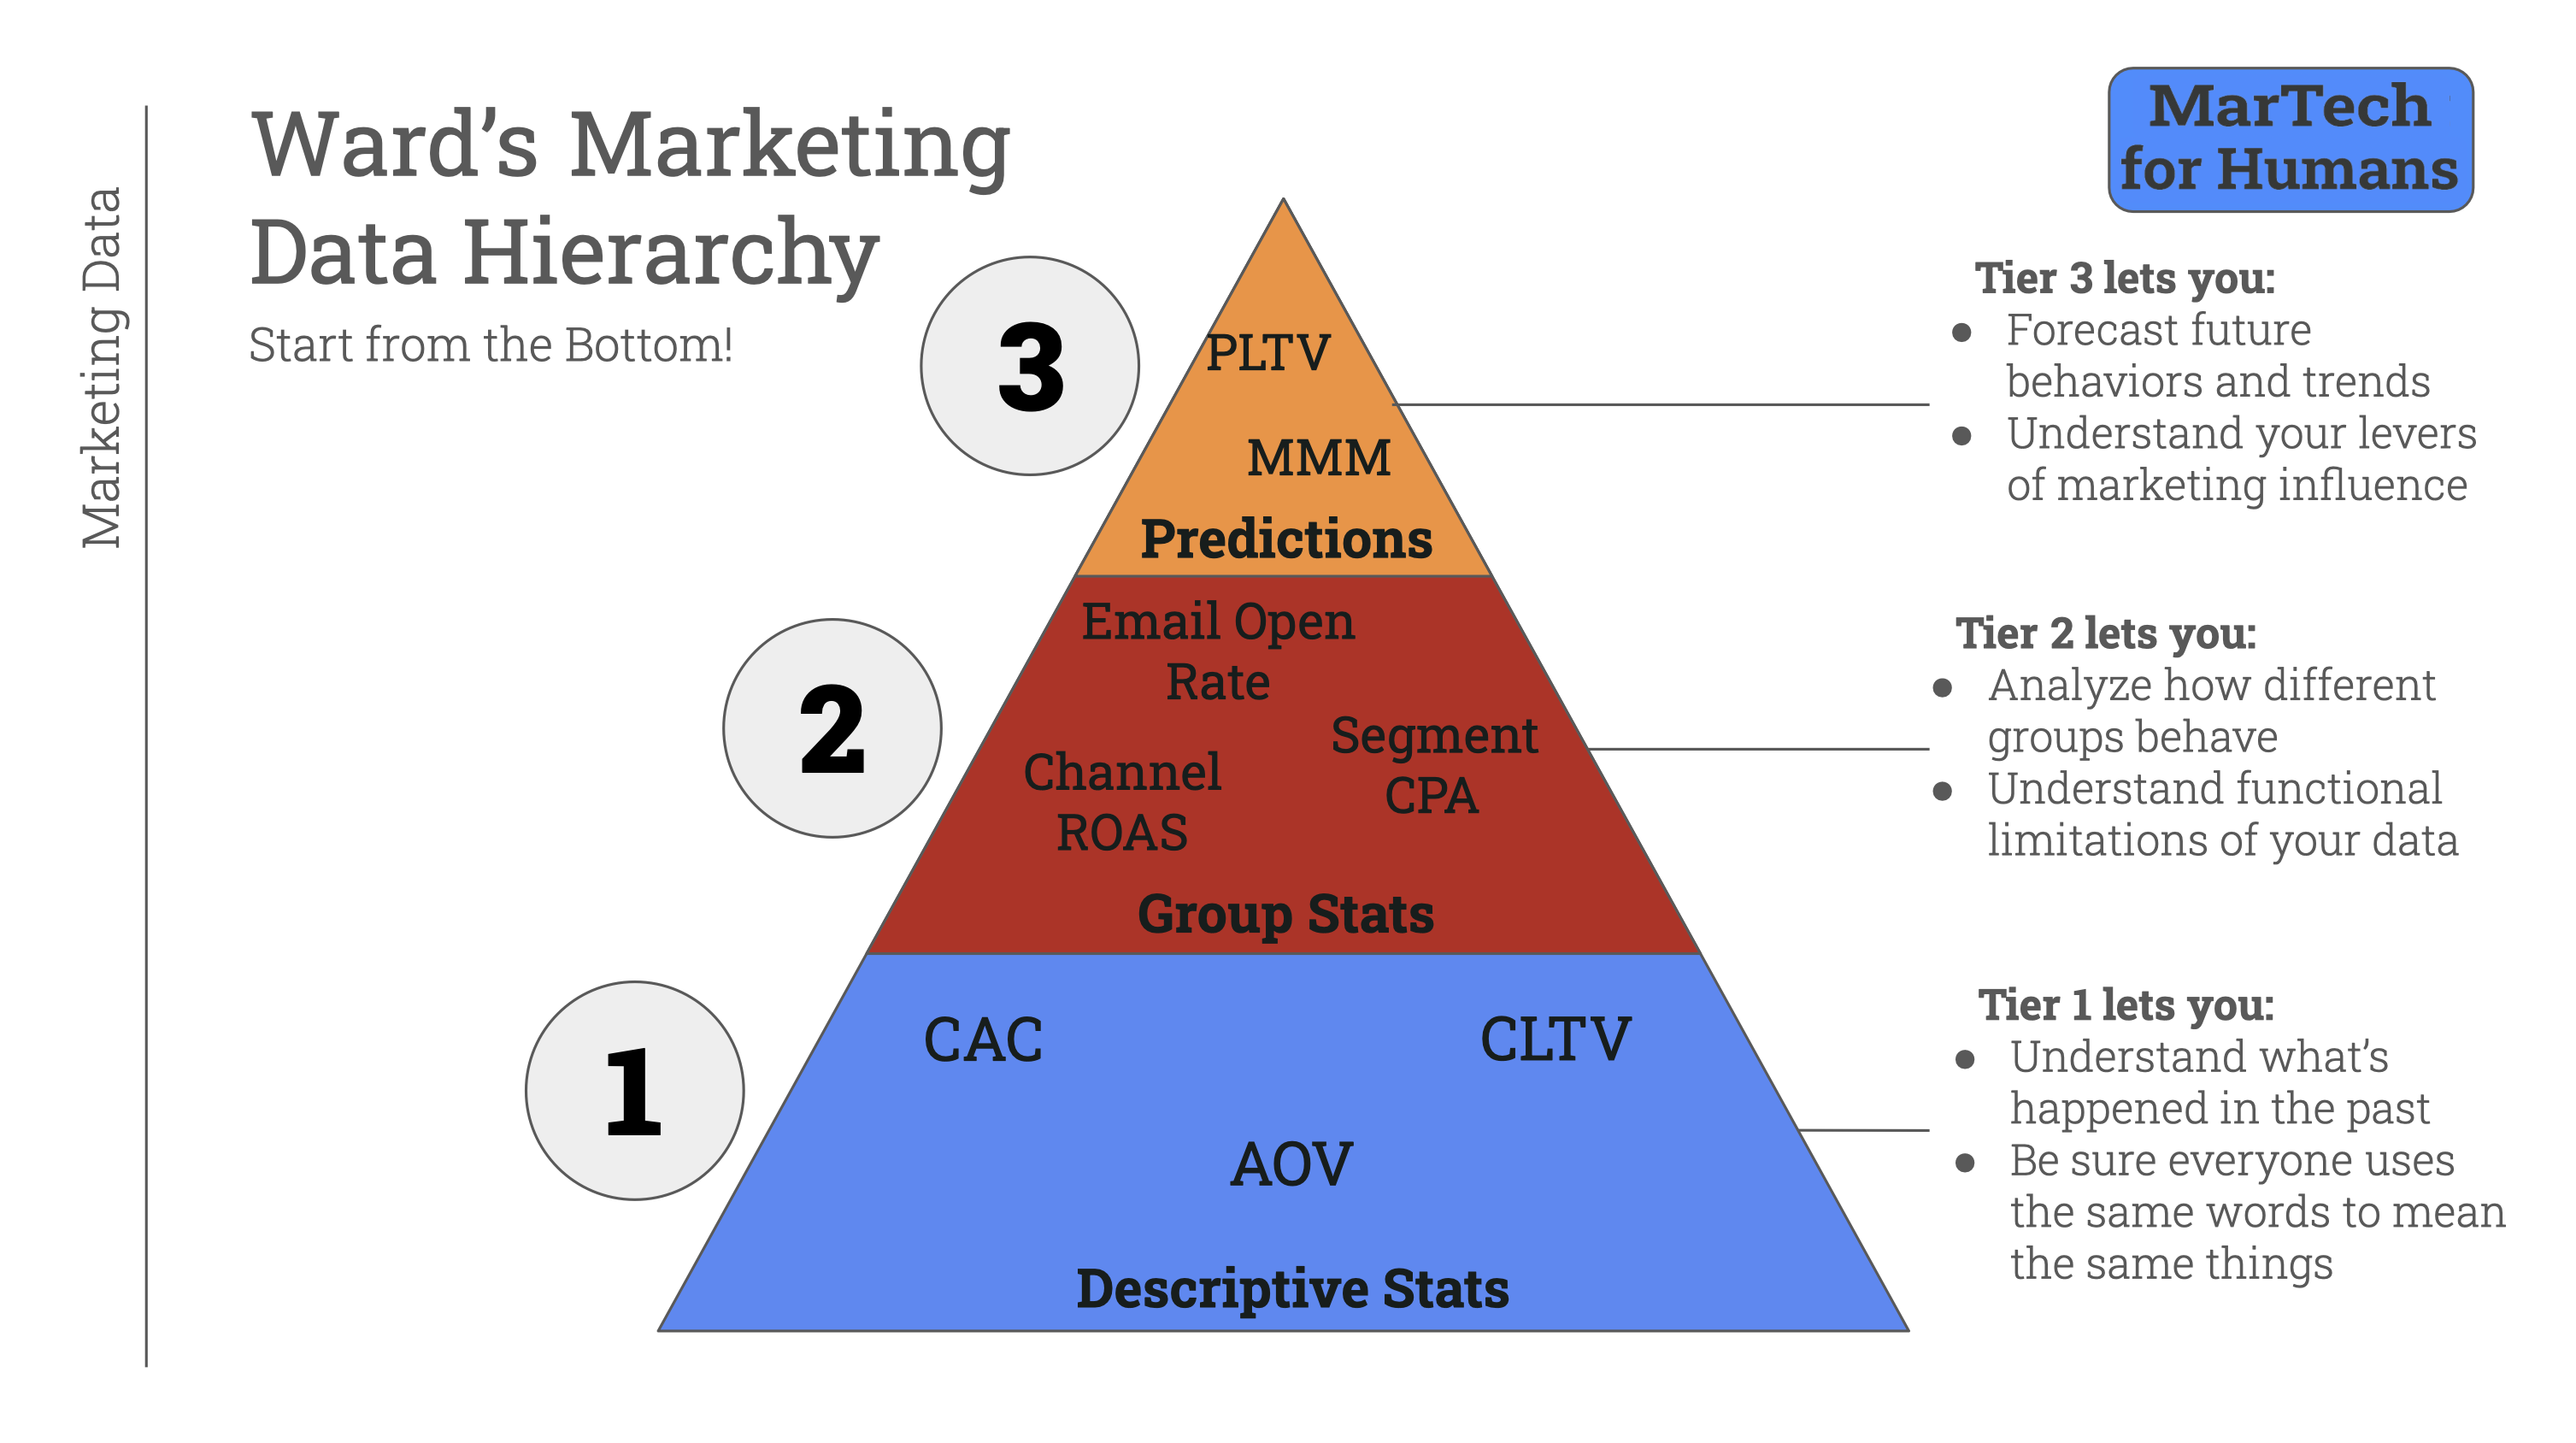
At the top of the marketing data hierarchy is predictive analytics. This tier uses historical data to forecast future behaviors and outcomes, helping you make proactive decisions.
Key Activities in This Tier:
Predictive Modeling: Use statistical models to predict future customer behaviors, such as churn likelihood or purchase propensity.
Media Mix Modeling: Analyze how different marketing channels contribute to sales and optimize your media spend.
Sensitivity Analysis: Evaluate how changes in different variables (e.g., price, advertising spend) affect outcomes.
Common KPIs at this stage:
Predictive Lifetime Value (PLTV): What is your best estimate for the future value of customers based on their past behavior?
Churn Probability: What is the likelihood of specific customers leaving your business?
Conversion Probability: What is the likelihood of prospects converting into paying customers based on engagement?
Conclusion
Building a robust MarTech strategy is much like building a skyskraper: you need a strong base to support the higher levels.
🤖 Marketing Bytes: Digital Data Basics

People struggle to manage digital data. Don’t worry—you’re not alone. But a strong understanding of fundamentals helps keep you afloat. Now that the world of marketing data has years of legacy decisions baked in, a good grasp of basics is important.
Instead of being lost adrift in all the marketing abbreviations, grab a lifeline at the bottom rung and work your way up.
By focusing on the right metrics at each stage, you can build a solid foundation that supports more advanced use cases and drives meaningful business results.
Further Reading and Resources:
Computer chips, although sand, usually don’t shift too much
Not actually trademarked. Use the framework however you want!
You’ll often see LTV as an estimate of how much a customer is likely to be worth. Although this is a useful calculation, it’s ahead of this level of data.
See definitions below